

Trick or Treat? How to Tell If Your Data Is Disguised
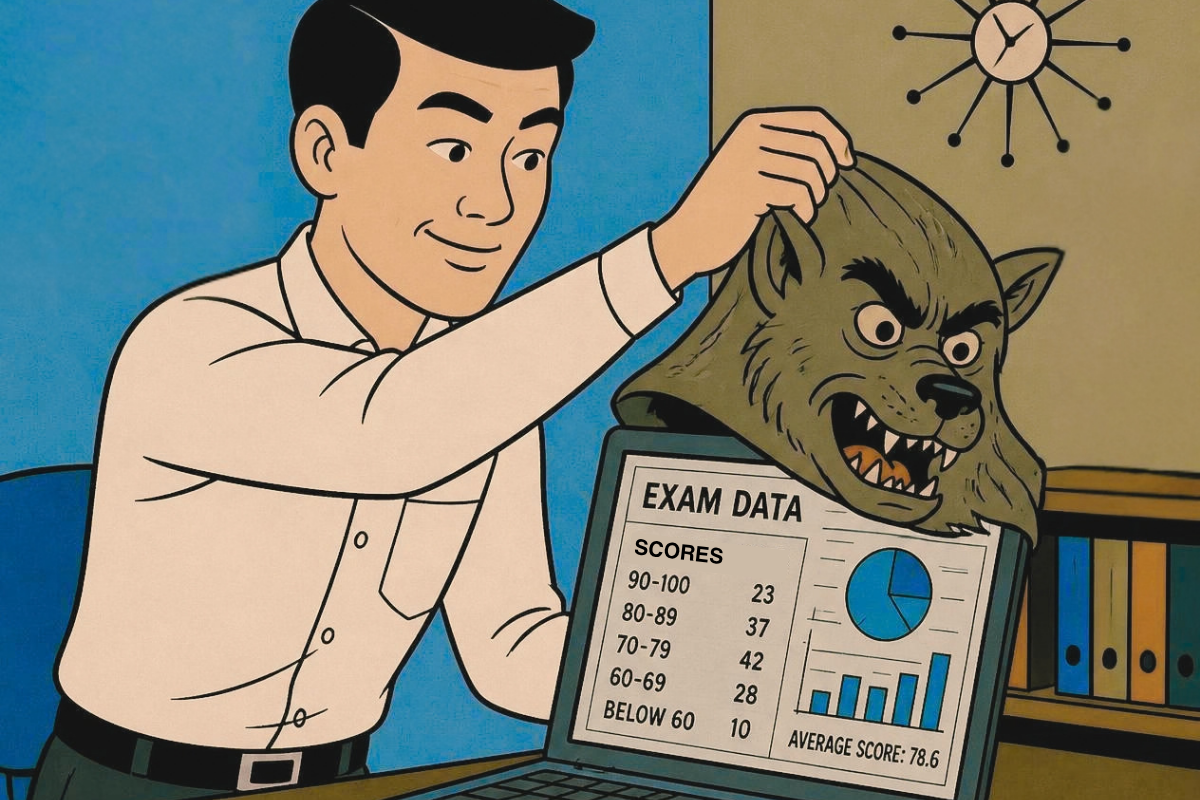
Halloween costumes are fun because they come off at the end of the night. Data can wear a disguise, too, but its costume doesn’t always come off on its own. A chart that looks alarming, a pattern that looks suspicious, or a survey result that says exactly what you hoped to hear might be something else entirely under the mask.
Misreads matter for credentialing programs because they can shape which exam items get retired, which candidates get flagged, and what your next exam should cover. The good news is you don’t need to be a psychometrician to spot data in disguise. You just need to know which questions to ask. Here are three common disguises and how to spot them.
Keep It Consistent: Don’t Fall for the Jump Scare
Every exam program tracks reliability, a measure of how consistently an exam produces trustworthy scores. Reliability is reported as a number between 0 and 1, and high-stakes exams generally aim for 0.80 or higher.
Take a look at the chart below. It shows the reliability of one exam form over three years.
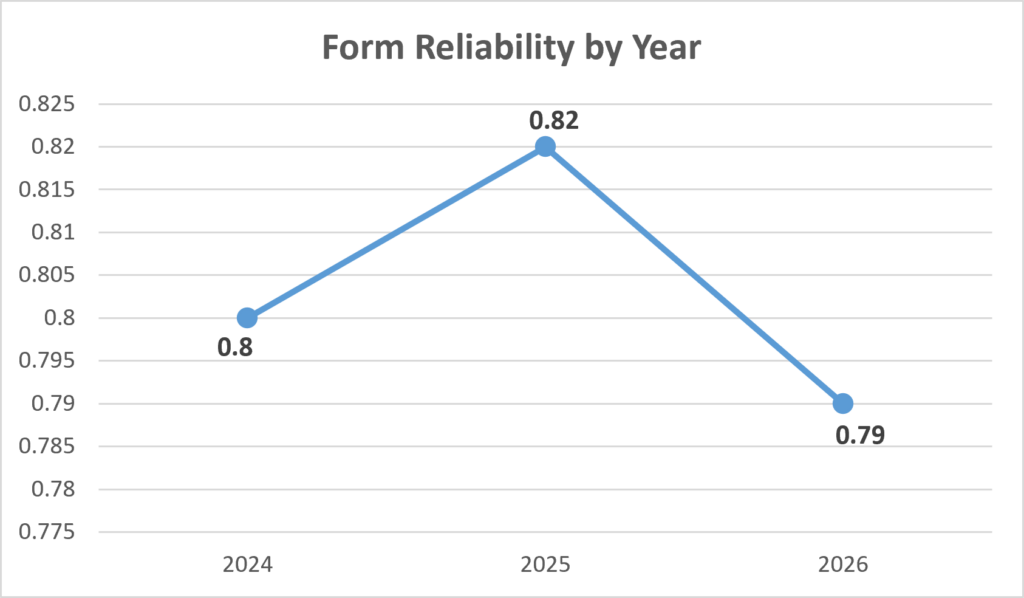
Yikes, right? It looks like reliability fell off a cliff in 2026. But check the numbers along the side. The chart zoomed in so tightly that a drop of just 0.03 looks like a free fall. That’s the jump scare.
Many charting tools zoom in automatically, and the zoom shifts every time new data is added, so the same exam can look calm one year and terrifying the next.
Here’s the exact same data on a fixed scale from 0 to 1:
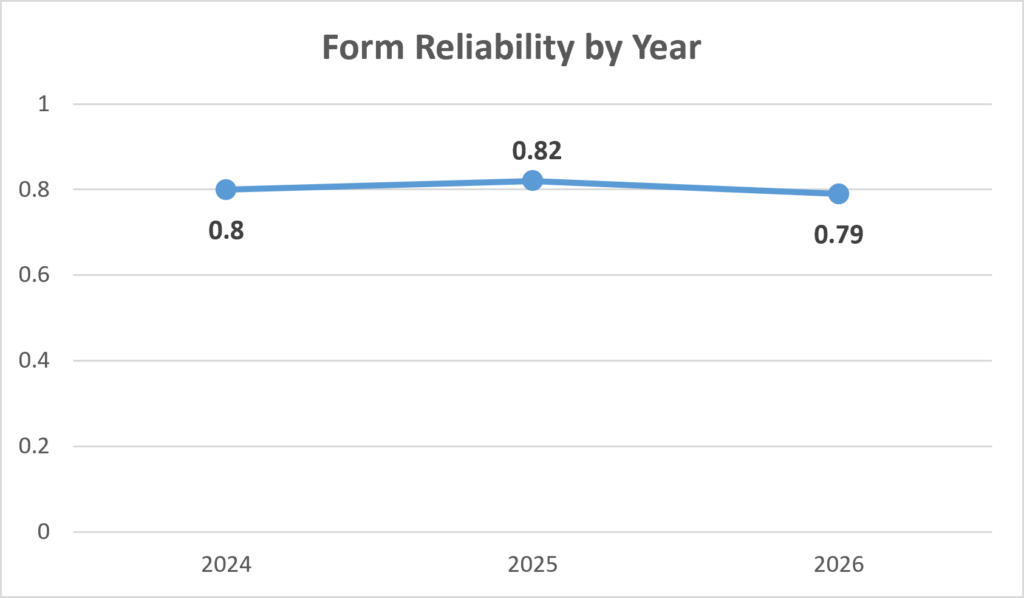
Much less frightening. Reliability did dip just below the 0.80 target, which is worth keeping an eye on, but one small dip doesn’t make an exam unreliable. Some movement from year to year is normal as the number and mix of candidates change.
The more useful questions are practical ones:
- How long has this form been in use?
- How many candidates have seen it?
- When was it last reviewed?
Those answers help you decide whether it’s time for a new form.
Takeaway: Ask to see your data on the same scale every time. Consistent charts make true variations easy to spot and prevent false alarms.
Don’t Create a False Narrative: Not Every Creak Is a Ghost
Haunted houses are known to creak and groan. The question is whether anything is actually there.
When a program suspects a candidate of cheating or stealing exam content, it may need to investigate. Sometimes testing-center videos or photos make the answer clear. Other times, the footage is inconclusive, and all that’s left is the data: how long the candidate spent on each question, whether they changed answers, and which questions they saw before and after breaks.
It’s easy to start seeing shapes in the shadows. A fast answer here, a changed response there, and suddenly a story takes form. But a pattern only means something when you can compare it to what’s normal. Without a baseline, such as how typical candidates behave on the same exam, a perfectly ordinary pattern may become spooky-looking.
The stakes are high on every side. The decision affects the candidate, the integrity of your credential, and the trust of every candidate who comes after. Each case deserves a fresh, open-minded look.
Takeaway: Let the evidence tell the story, not the other way around. If the evidence is only circumstantial, the most defensible conclusion may be that there isn’t enough to reach one.
Survey Data: Don’t Let the Ouija Board Do the Talking
Survey results can work a little like a Ouija board. Push hard enough, and they’ll spell out whatever you want to hear.
One of the most important surveys in credentialing is the job analysis survey (also known as a job task analysis, role delineation study, or practice analysis). Every few years, programs ask people in the profession what their work involves. The results do two big jobs:
- They confirm which tasks, knowledge, and skills belong on the exam
- They set how much weight each topic gets on the exam blueprint
A few decisions shape what the survey can reliably tell you:
- Set the Rules Before You Read the Results: Decide in advance what rating a task requires to earn a spot on the exam. Anything that falls short goes to a panel of qualified experts, who decide whether to keep it or cut it.
- Know Who’s Answering: Newly certified professionals and 20-year veterans may see the job differently, and so might credential holders and non-holders. If their answers line up, great! You can treat them as one group. If they don’t, someone needs to decide whose view carries more weight, or how to blend them, and document why.
Takeaway: There’s more than one way to analyze survey data. The right way is the one you can explain and defend. Without a clear rationale, a conclusion is just a ghost story.
Disguised Data: No Tricks, Keep the Treats
Data is one of a credentialing program’s most valuable tools. Presented clearly and without an agenda, it helps boards and staff make confident, defensible decisions. The trick is making sure you’re looking at the data itself, not its costume.
Before your next board meeting, keep three questions in your pocket:
- Is this shown the same way as last time?
- What are we comparing it to?
- And why did we choose this approach?
If your data is looking kind of scary, Quadterion can help you pull off the mask to reveal what’s really underneath. Reach out to our team to learn more.